Danomics Petrophysics & Log Analysis
At Danomics we believe that adherence to petrophysical workflows yields high-quality, consistent, and repeatable results. The results will still vary from interpreter to interpreter, but that variation should be smaller. Furthermore, when doing a “petrophysical audit” of results it should be easier to understand how that answer was derived.
In this article I will outline the approach and workflow that we take when doing evaluations on moderately sized data sets and are working on a tight timeline. This is the procedure we use when we do a “100 well challenge” for a company to demonstrate the power of our software.
The Petrophysical Workflows
There are two workflows that can be applied. The first is a standard deterministic workflow, such as the one shown here:
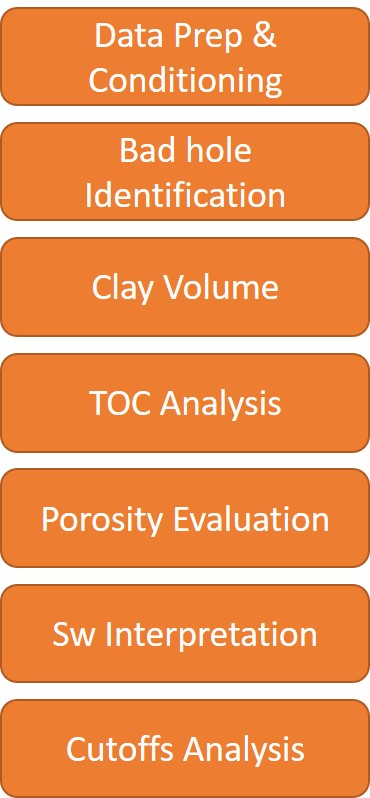
The deterministic workflow is an excellent starting point for any analysis and can be executed in most software packages, albeit with vary levels of sophistication.
With any workflow you’ll want to start by properly preparing and conditioning your data. This consists of three steps – creating a consistent naming convention, ensuring that your data is apples-to-apples and that you have accounted for the variations that arise between different vendors and tool generations.
Danomics does a lot of this for you out of the box and behind the scenes. We have a built in alias table of over 7500 curve mnemonics to split and assign data into the right name space. We then do things like check if curves are in percent or decimal or have been logged in different units (e.g., a density porosity vs. a bulk density) and make corrections for different matrices (e.g., limestone vs. sandstone matrices).
To account for data variations there are two options – normalization or parameter remapping. In general, we recommend normalization as it gives the user more control. You can find how to do that in our curve normalization module.
Once this is done the user will then need to identify washouts and badhole. This is done through the Badhole ID and Curve Repair module. The objective here is to identify areas where the density curve is especially bad so that we don’t create misleading results for porosity.
After this is completed the user will walk through the Clay Volume, TOC, Porosity, Saturation, and Cutoffs modules. There are numerous options available in Danomics for each of these, and the user should experiment to see which method(s) give the best results.
In general, we prefer to use the following:
| Module | Methodology |
| Bad hole ID & Repair | Caliper Rugosity, Drho, and Density cutoffs |
| Clay Volume | Vclay from Neutron-Density and Vclay from GR matched to N-D results |
| TOC Analysis | Modified Passey |
| Porosity | Density porosity via grain density methodology |
| Water Saturation | Archie-PhiT for organic shales, Archie or Simandoux for conventional systems with Rw remapping in all cases |
We typically apply these methods to a handful of wells (perhaps 3-5 for a 100 well projects). Once this is done we set one of these wells to be our “key well” and watch the analysis progress (takes about two minutes for 100 wells). We’ll then QC the results by maps, cross sections, and blind checks on wells. We can then iterate as needed on individual modules.
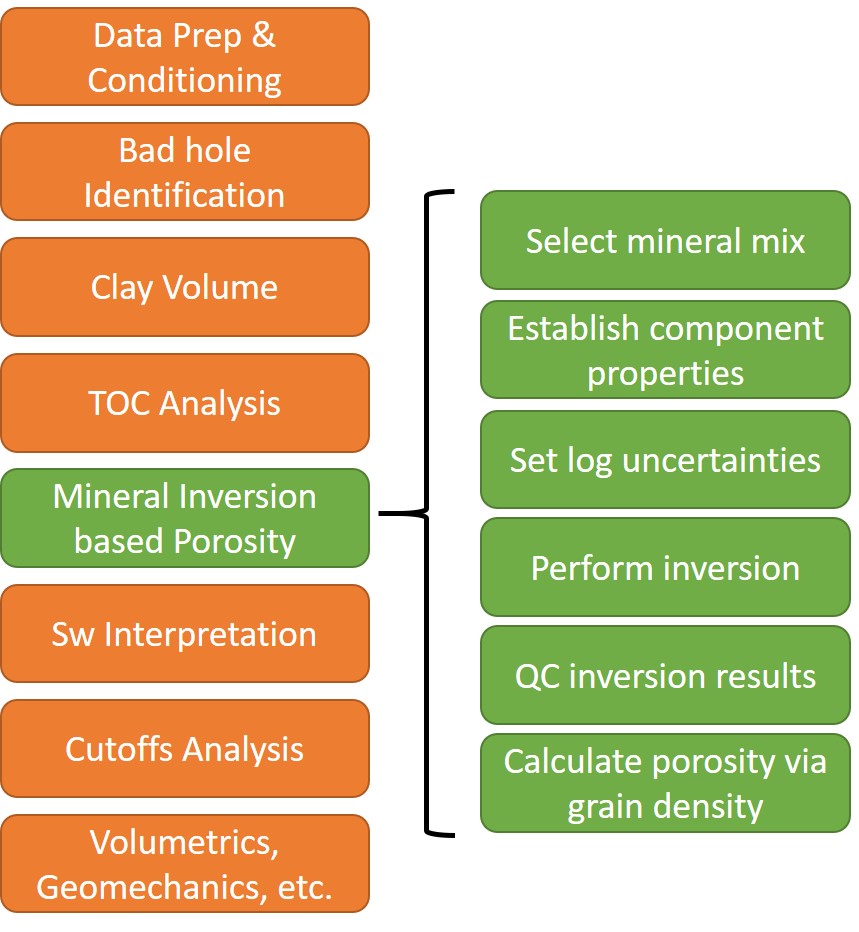
In the probabilistic workflow, you’ll notice that most of the steps are exactly the same. The only difference is that we’ll use a mineral inversion based porosity. This process offers superior results when performed correctly, and is quite stable over large projects.
The reason it offers superior results is that with this method we are determining the mineral mixture, which then allows us to calculate the grain density quite precisely. It also means that we can calculate the the fluid density, providing the most tuned results possible.
Many geologists and engineers are uncomfortable with this method because they haven’t been widely exposed to it. However, as we explained in this article, it is not a black box, and the results are quite easy to interpret.
For a conventional system with 10%+ porosity rocks and simple mineral mixtures both will give you the same results. However, in complex lithology and mixed lithology systems, the inversion is worth the little bit of extra effort.
The 100 well challenge
Danomics often offers companies the opportunity to do a “100 well challenge”, in which we will take up to a 100 wells from a play/field and run them through our workflow. We’ll then deliver the results to you in the form of summary CPI tables, and LAS exports with all of the result curves.
It’s then up to you with what you want to do. We’ll provide you a 30 day trial and help you recreate the results on your own. And of course, we treat all your data as proprietary and we don’t share it with others or use it for any other purpose other than to show you how our software can help you bring more petrophysics into your subsurface workflows.