This article outlines how to use Flows to generate a lithofacies model utilizing multiple wells. This requires using four flows building blocks:
- LogInput
- CpiLogCalc
- FaciesFit
- PointsOutput
The assembled flow is shown below:
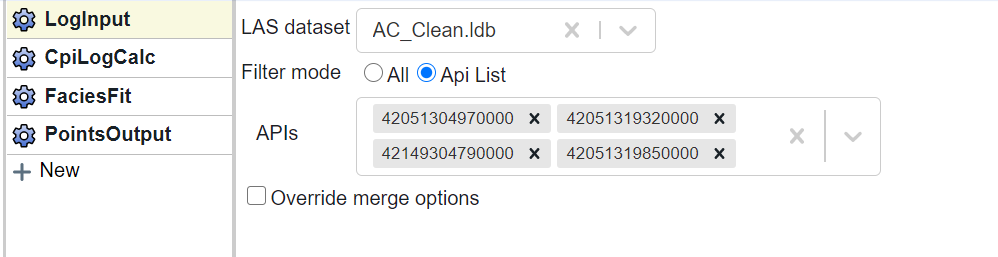
In the LogInput block select the database of interest using the dropdown menu. It is advisable to use a limited well set, so select the Api List radio button and then type in the desired API numbers.
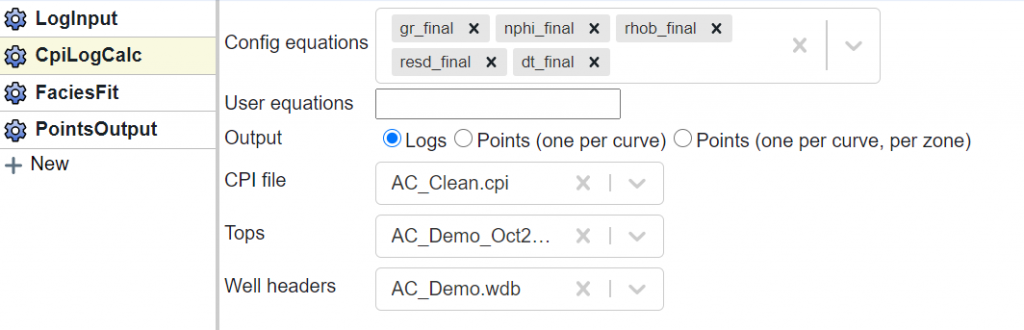
In the CpiLogCalc block you will designate the logs you want to use in the Config equations section. In this example we want to use the “_final” curves as they will have already been composited, normalized, and/or repaired in washout intervals. We will set the Output as Logs. Finally we will select the CPI file, and tops and well headers database that we want to use. This is important because the CPI file is required to make sure that all the parameters are correctly captured.
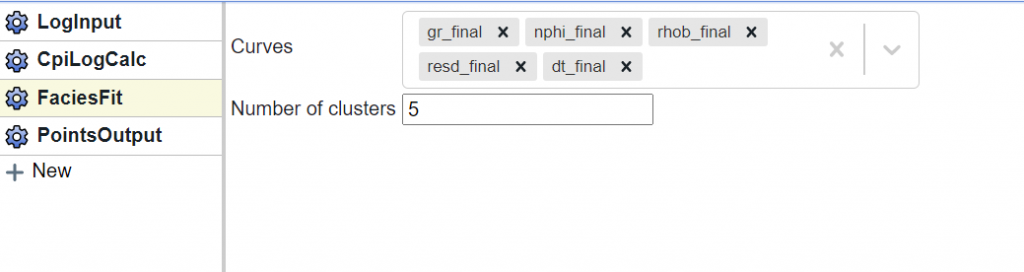
In the FaciesFit block you will select the curves you want to use in the K-means lithofacies model and the number of clusters to make. Note, you are limited to using the curves that were selected in the CpiLogCalc config equations section.
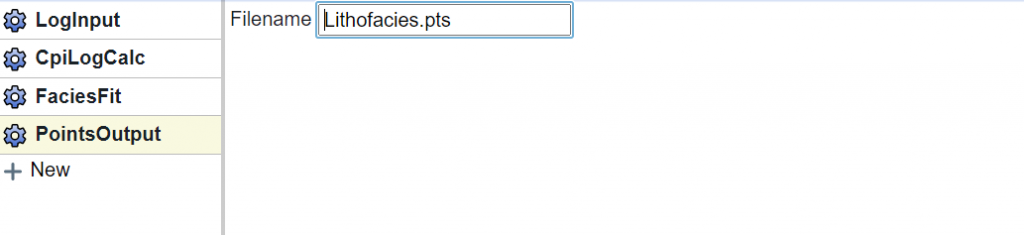
Finally, you will need to output the results. In this case we output these as points using a PointsOutput block.
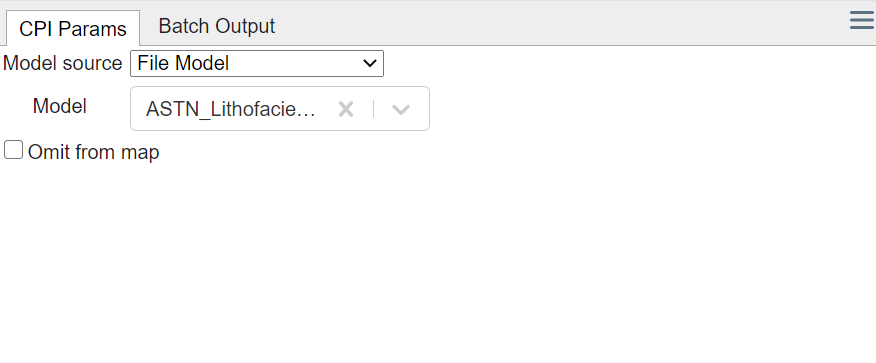
Once this is done, open your CPI file, navigate to the Lithofacies module, open your key well, and select “File Model” as the Model source. Then, under Model, select the points dataset generated in the previous step (shown below).
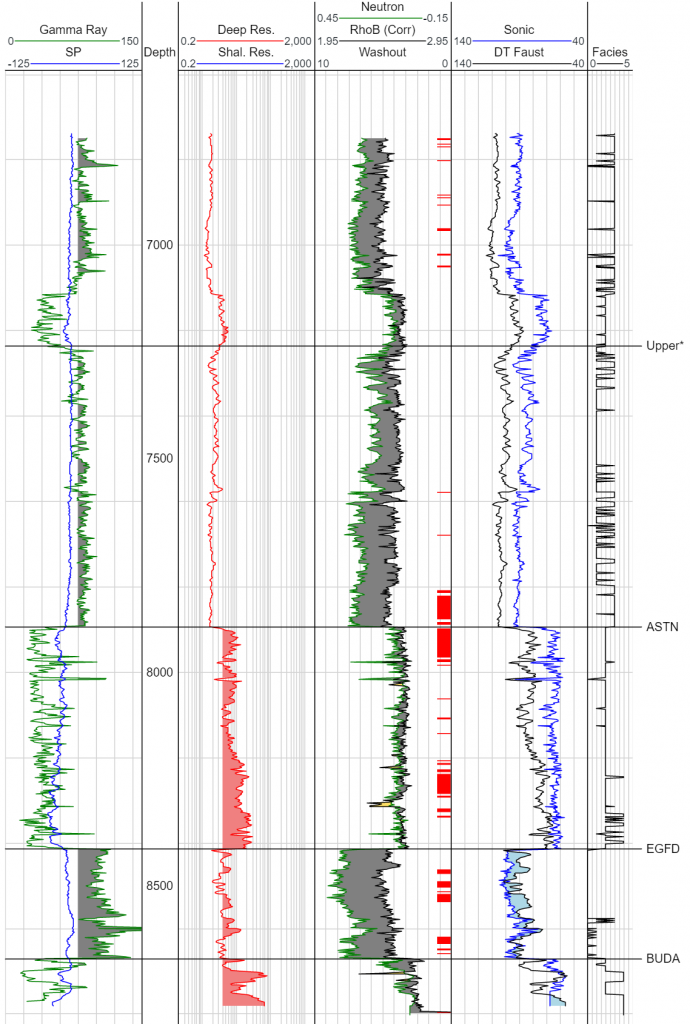
Now you’ll have a facies curve that is based on that multi-well model. The log results are shown below.