This article covers how to export results. Once you have created a new project, modified your interpretation, and customized the economics you will probably want to export the results as a next step.
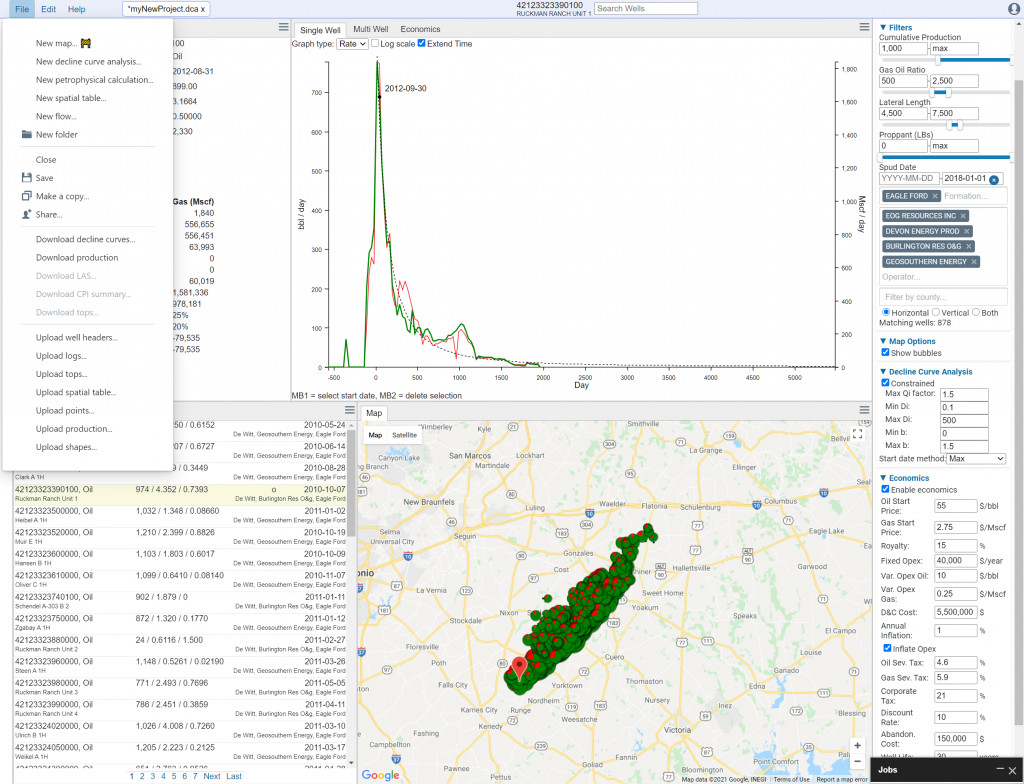
To do this, simply go to File >> Download decline curves…
After clicking a confirmation box will appear, and then the export will begin. You can track the status in the “Jobs” tab, as shown below.
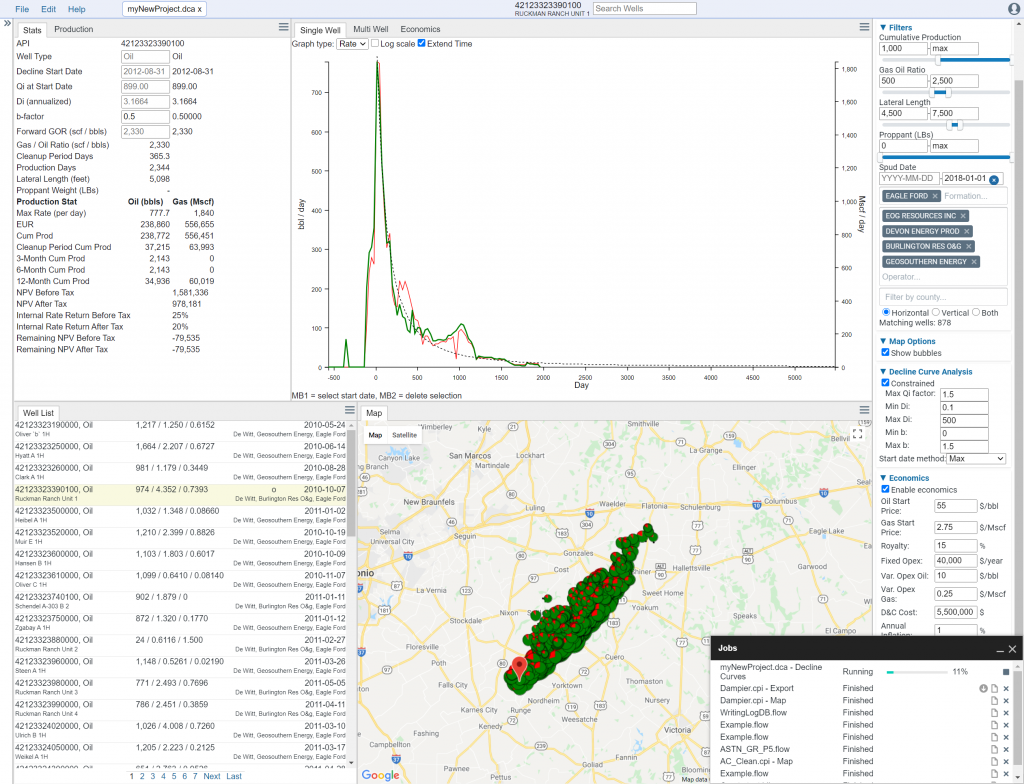
In general the software should process ~1000 wells with monthly production data per minute. Daily data and analyses using “Best Fit” can take longer.
The results will download as a CSV file in your web browser.