In Danomics Petrophysics Insights users are guided through a workflow that walks them through a number of modules. These modules are located via a dropdown menu at the top center of the window. The modules are listed in the order in which a user should ideally proceed through a project. However, this order is not strictly enforced and the user can start at any module and can seamlessly move both forward and back through the modules. This help article will focus on the 1D Geomechanical Earth module.
1D Geomechanical Earth Model
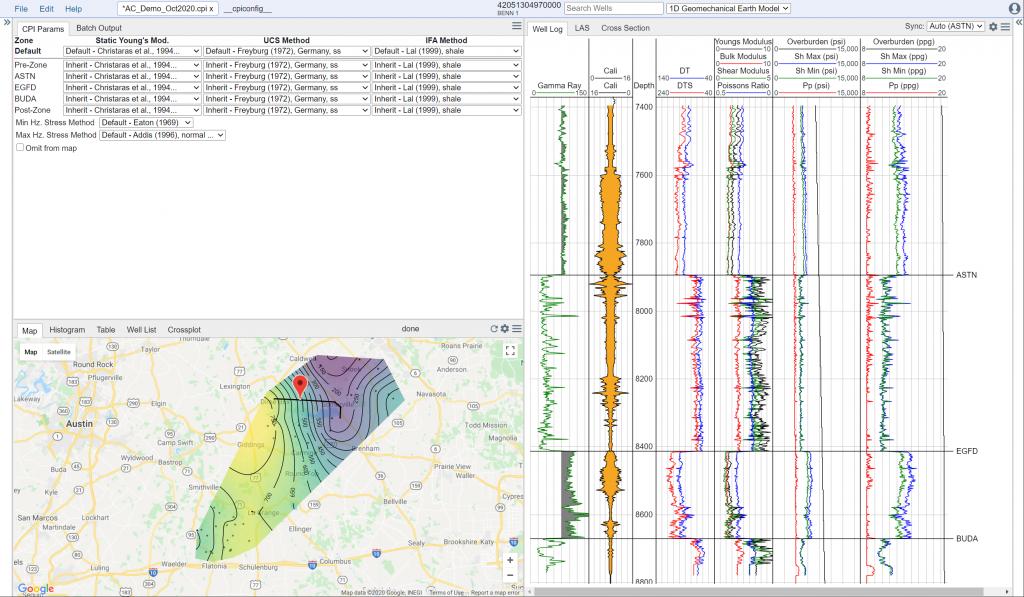
Danomics 1D GEM helps users determine rock strength and anticipate drilling failures. To do this the user needs to set the methods to convert from a dynamic Young’s moduls to a static modulus, evaluate the unconfined compressive strength, determining the internal friction angle, and quantifying the minimum and maximum horizontal stresses.
- Static Youngs: Danomics includes nine correlations that can be used. For a description of each see Brotons et al., 2015 article on the Improved correlation between the static and dynamic elastic modulus of different types of rocks.
- UCS Method: Danomics includes 17 correlations that can be used. For a description of each see Chang et al., 2006 article Emprical relations between rock strength and physical properties in sedimentary rocks.
- IFA Method: Danomics includes 3 correlations for internal friction angle. For a description of each see Chang et al., 2006 article Emprical relations between rock strength and physical properties in sedimentary rocks.
- Minimum Hz. Stress Method: Minimum horizontal stress can be calculated via four methods. Aidil Adham provides an excellent overview in his thesis from Colorado School of Mines titled Geomechanics model for wellbore stability analysis in field “X” North Sumatra Basin.
- Maximum Hz. Stress Method: Maximum horizontal stress can be calculated via three methods. Aidil Adham provides an excellent overview in his thesis from Colorado School of Mines titled Geomechanics model for wellbore stability analysis in field “X” North Sumatra Basin.
Key Outputs
| Curve | Description |
| static_youngs | Static Youngs Modulus |
| vt_stress | Vertical Stress (psi) |
| cohesion | Cohesive strength of rock (psi) |
| biot | Biot’s coefficient |
| min_hz_stress | Minimum Horizontal Stress (psi) |
| max_hz_stress | Maximum Horizontal Stress (psi) |
| vt_stress_ppg | Vertical Stress (ppg) |
| min_hz_stress_ppg | Minimum Horizontal Stress (ppg) |
| max_hx_stress_ppg | Maximum Horizontal Stress (ppg) |
All stresses are calculated in pounds/square inch (psi). These are then duplicated in pounds per gallon units for easier evaluation against mudweight data.
Tips and Tricks
- Import your mudweight data – this will allow you to visualize where the pore-pressure exceeds the mudweight (blowout hazard) and where mudweight exceeds the horizontal stress, which can cause compressive or tensile failures
- Pay attention to the lithology – most of the correlations are specific to shale, sandstone, or limestone.
- The Shear log modelling module should be ran prior to evaluating results from this module if a shear log was not ran in the well.