Note: This article is specific to Petrophysics Insights.
Once you have loaded in your data you are ready to start a new project. In this tutorial we focus on evaluations using Petrophysics Insights.
Create a New Project
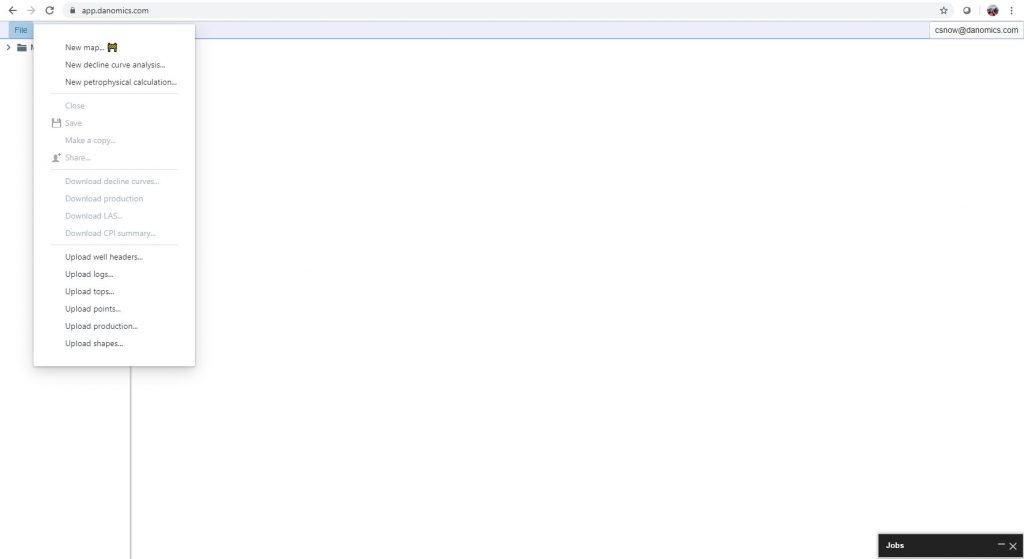
To start a new project go to File>>New Petrophysical Calculation as shown in the image below:
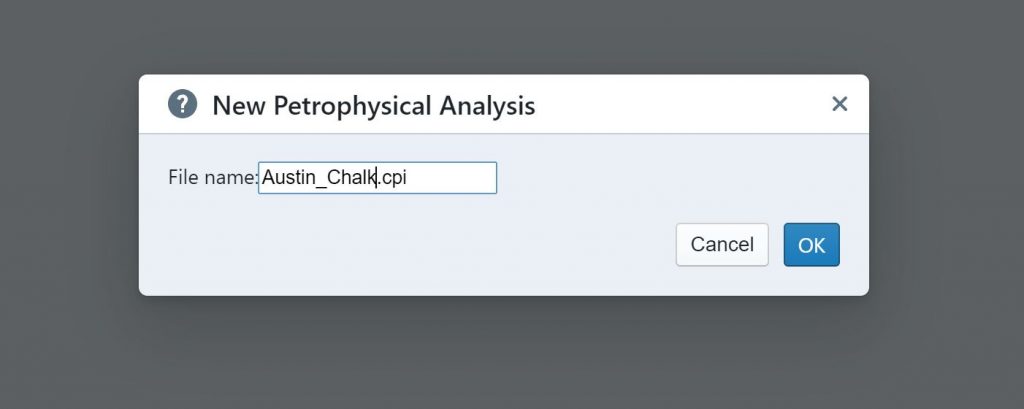
Upon clicking you will be presented with a dialogue as shown below. Enter in a name for your project and click “OK”.
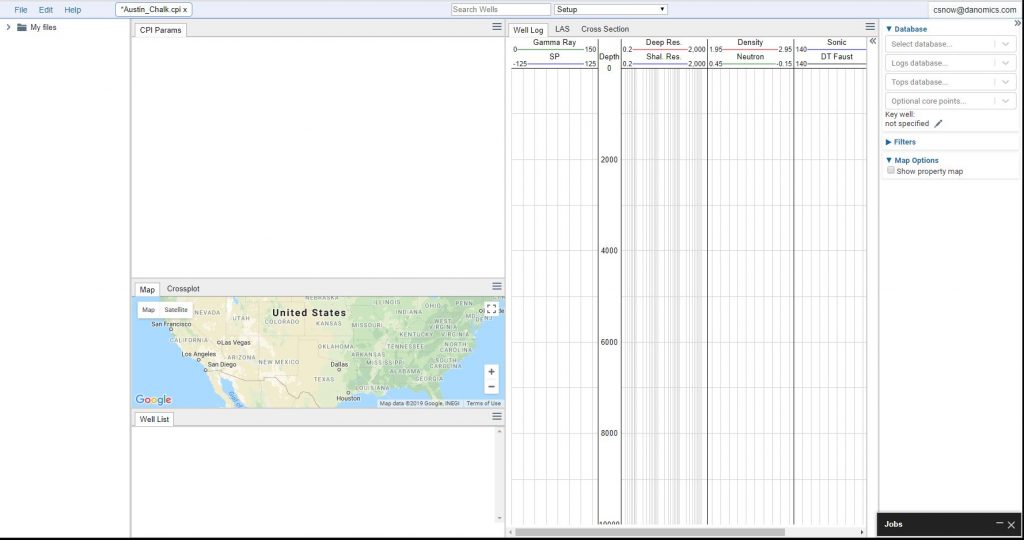
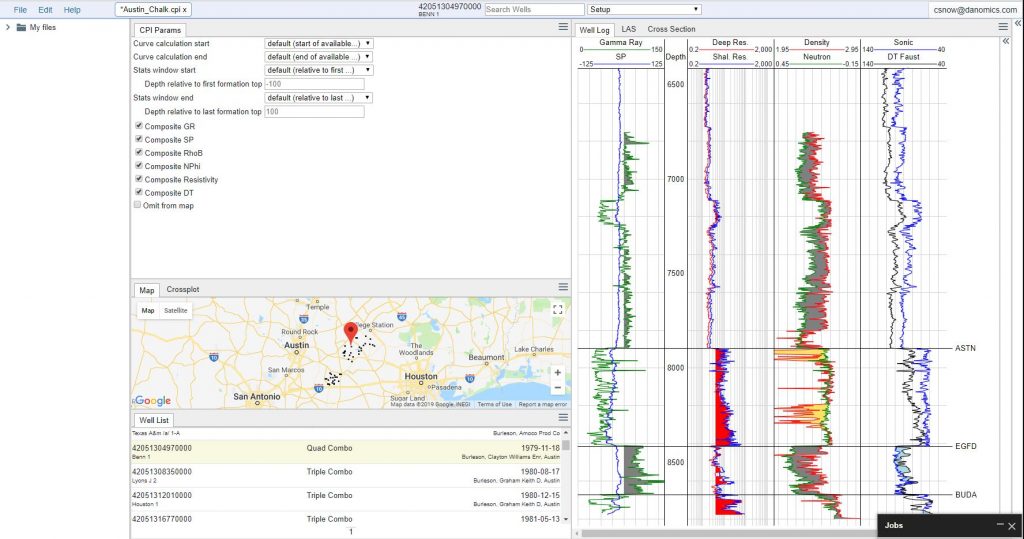
After clicking “OK” you will now have a new, empty project, as shown below:
Note: You need to save your project just like with any other software. You can do this by going to File>>Save or hitting ctrl+s on your keyboard. We recommend saving frequently.
Database Selection
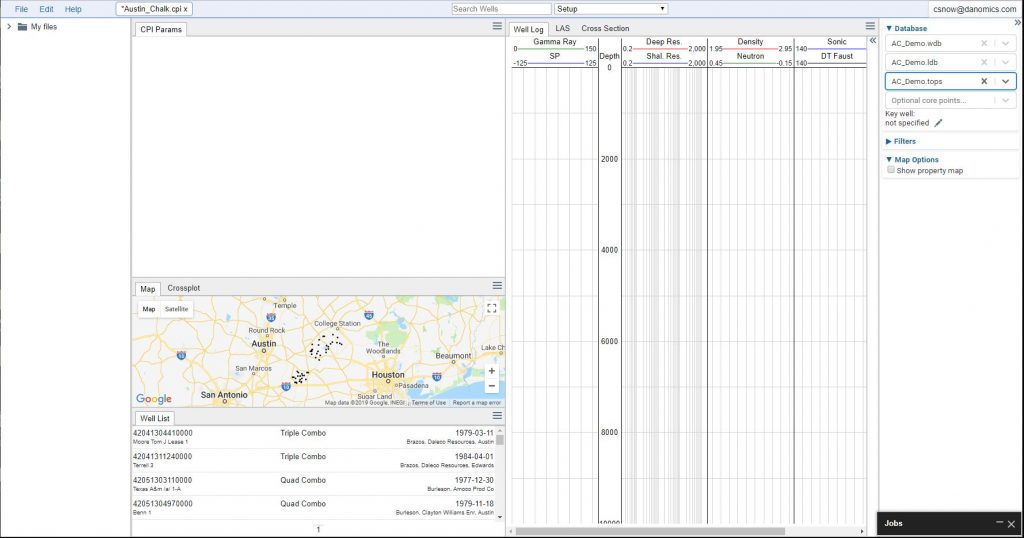
On the top right-hand side of the screen you should see an area labeled “Database”. Below this are four drop-down selection boxes. Only the databases relevant to each will be shown in the dropdown selection menu. Choose the databases for your analysis and save the project – it should now be populated with the data, as shown below. It is required to have a well header database, well log database, and well tops database. Core points are optional.
If you click on a well either in the well list or on the map, the well log panel will be populated.
Now you are ready to begin your analysis. However, before we start interpreting there are a few steps to get set up.
Project Set-Up
Before you start interpreting it is recommended that you at least make a preliminary decision on the key well, calculation ranges, statistics window ranges, and whether or not to normalize some or all of your well logs. Don’t worry! You can change all of this on the fly later.
Key well selection
One of the most important decisions is what well you want to use as your key well. The methods and parameters you apply to this well will be applied to all other wells in the project. Typically you would want to select a well that has been interpreted by your petrophysicist or that has a complete suite of log data.
The methods you choose for this well (e.g., Vclay, porosity, and saturation methods) will be used for other wells. The parameters you select will be remapped (if applicable) and applied to the other wells. Parameter remapping is Danomics’ algorithm-based methodology for pushing your interpretations to other wells – not using fixed values, but instead analyzing your parameter pick relative to the data distributions.
To set your key well go to the pane where you earlier selected your databases. Beneath this you will find a box named “Key well API:” Enter in the UWI/API number of your key well. In the example below the well 42051304970000 has been selected.
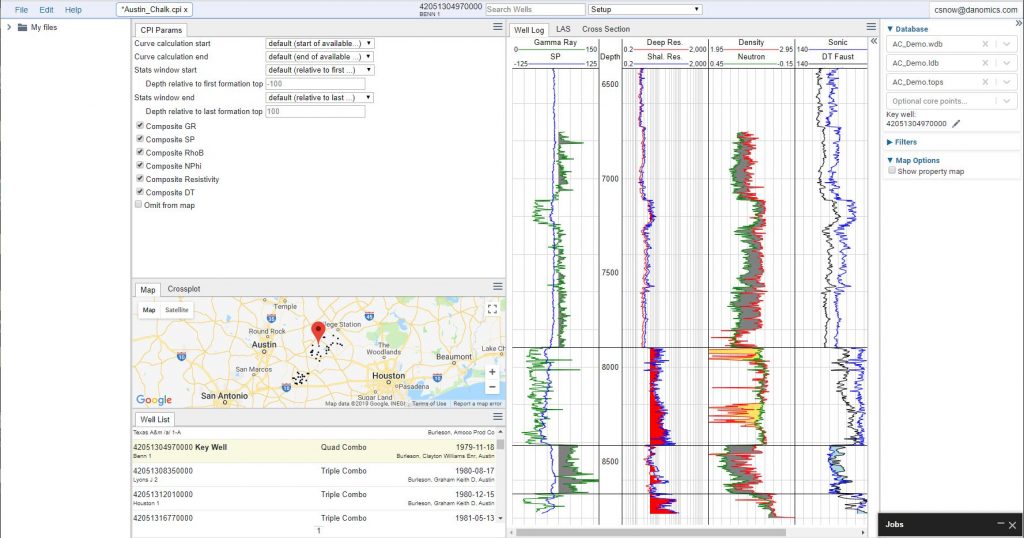
Once you have selected your key well you should save your project.
Calculation Ranges & Statistics Windows
Once you have chosen a key well use the dropdown selection menu above the well log panel and select the option “Setup”. Here you will make choices on the depth ranges for which you will make calculations and the “Statistics Window” that will be used for generating the statistics for subsequent processes like parameter remapping and curve normalization.
The calculated depth ranges is mainly a user-preference and not a technical decision. If you want to see calculated curves from top to bottom use the options for start/end of available data, whereas if you only want to see interpretations for your zones of interest then select the options for relative to your formation tops. Many users often elect not to see calculations for shallow zones above their zones of interest as they find it distracting to do so.
The choice for your stats window is more important. We typically recommend using from 100-300 or more feet above and below your formations tops. You will want to evaluate how indicative this data distribution is to your zones of interest. Note: To go from from 100′ above you would type in -100. To go from 100′ below you enter 100.
Now you are ready to start interpreting!
Hints & Tips
If your curves aren’t appearing as you would like, check the calculation depth ranges – you may be artificially clipping them.
If you think that the curve remapping or normalization isn’t working well, consider trying a wider/narrower statistics window or a different key well.
If you data isn’t showing up, expand out the “filters” option below the databases selection are and look to see if you have accidentally filtered out wells based on well log curve presence or well deviation parameters.
Note, you will receive a warning if you put in a filter that removes your key well from the active filter set.