Make deeper insights into the subsurface with Danomics 3D property models. Rapidly move from logs to models with our mapping and petrophysics tools.
Danomics — Building tools for the geoscientist of the future
START FREE TRIALWith our collaborative, cloud-based interpretation platform you can integrate petrophysical analysis, geological mapping, and 3D modeling all in one tool — empowering you to fully characterize reservoirs and understand the subsurface from logs to models, faster than ever.
- Accelerate project timelines by combining scalable multi-well interpretation, mapping, and 3D model generation
- Generate reliable structure, isopach, and reservoir property grids using cloud-powered workflows
- Visualize and validate interpretations with cross-sections, maps, and 3D models — all in one platform
- Transform well data into complete reservoir insights for smarter development, acquisition, and divestment decisions
Engineers and geoscientists are making the switch.
Find out why at www.danomics.com
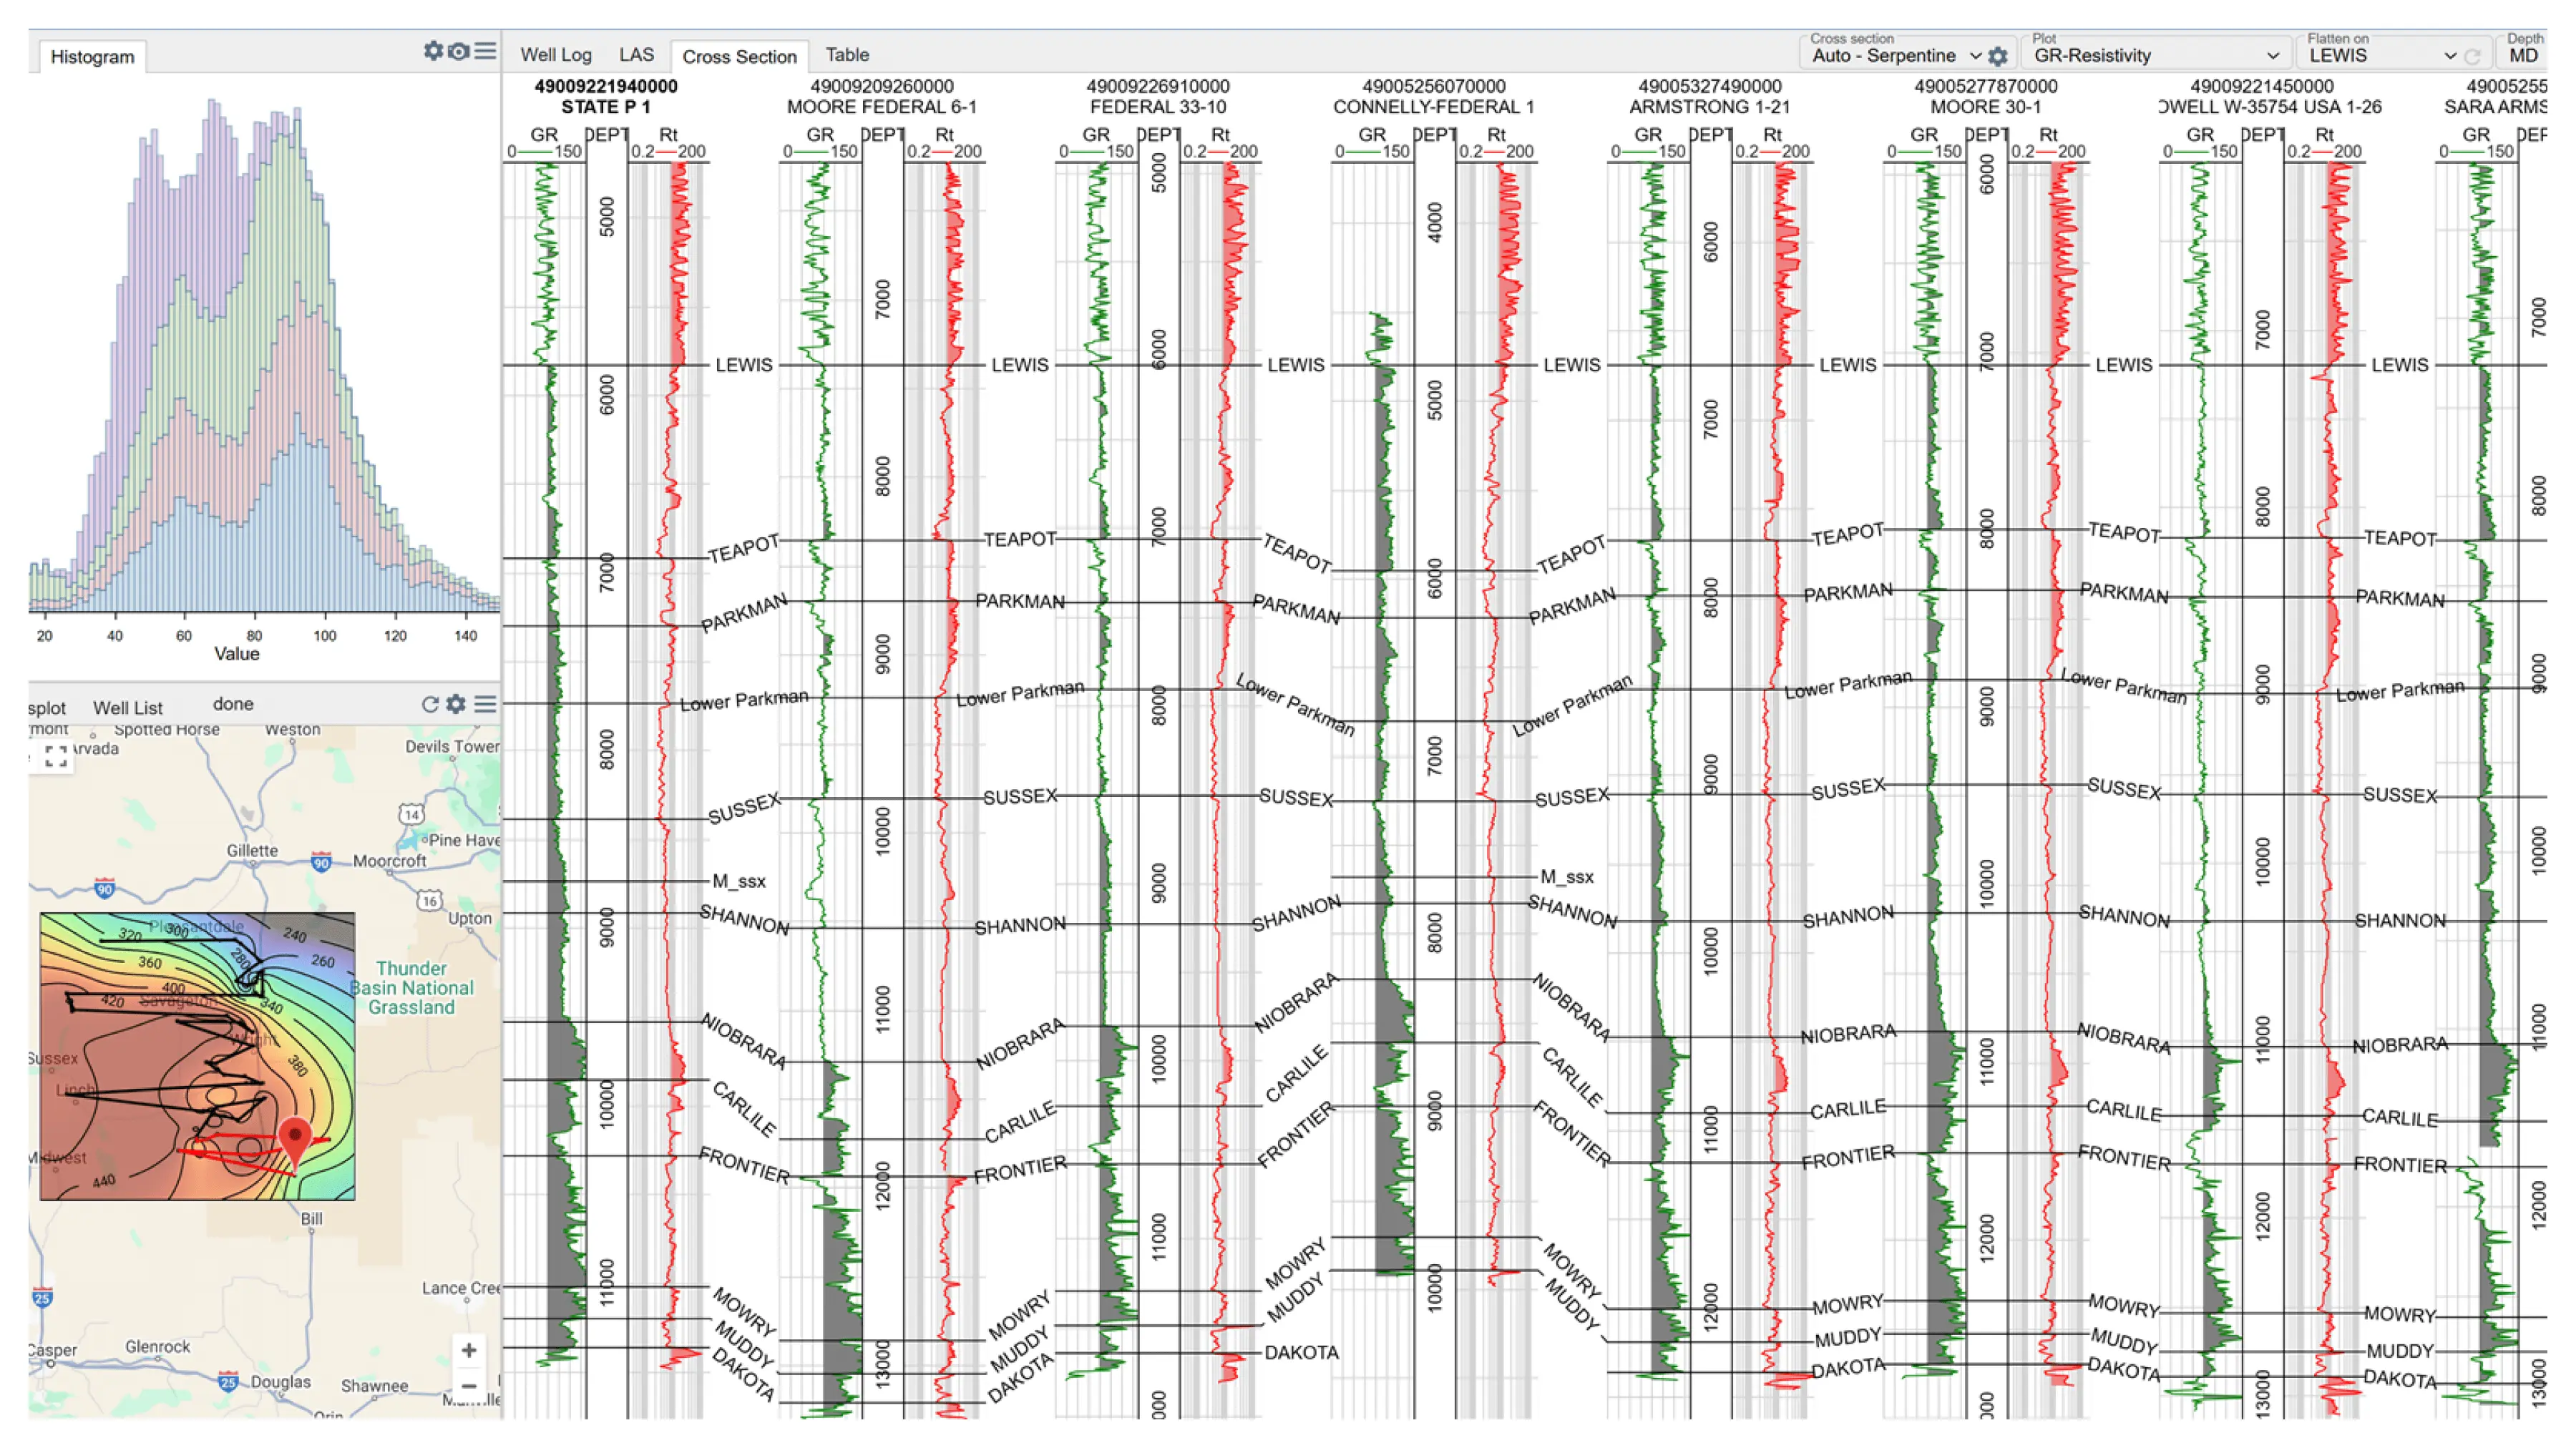
With our snappy and responsive cross-sections and automated tops picking you can build out the stratigraphic framework faster than ever before.
Go beyond the map
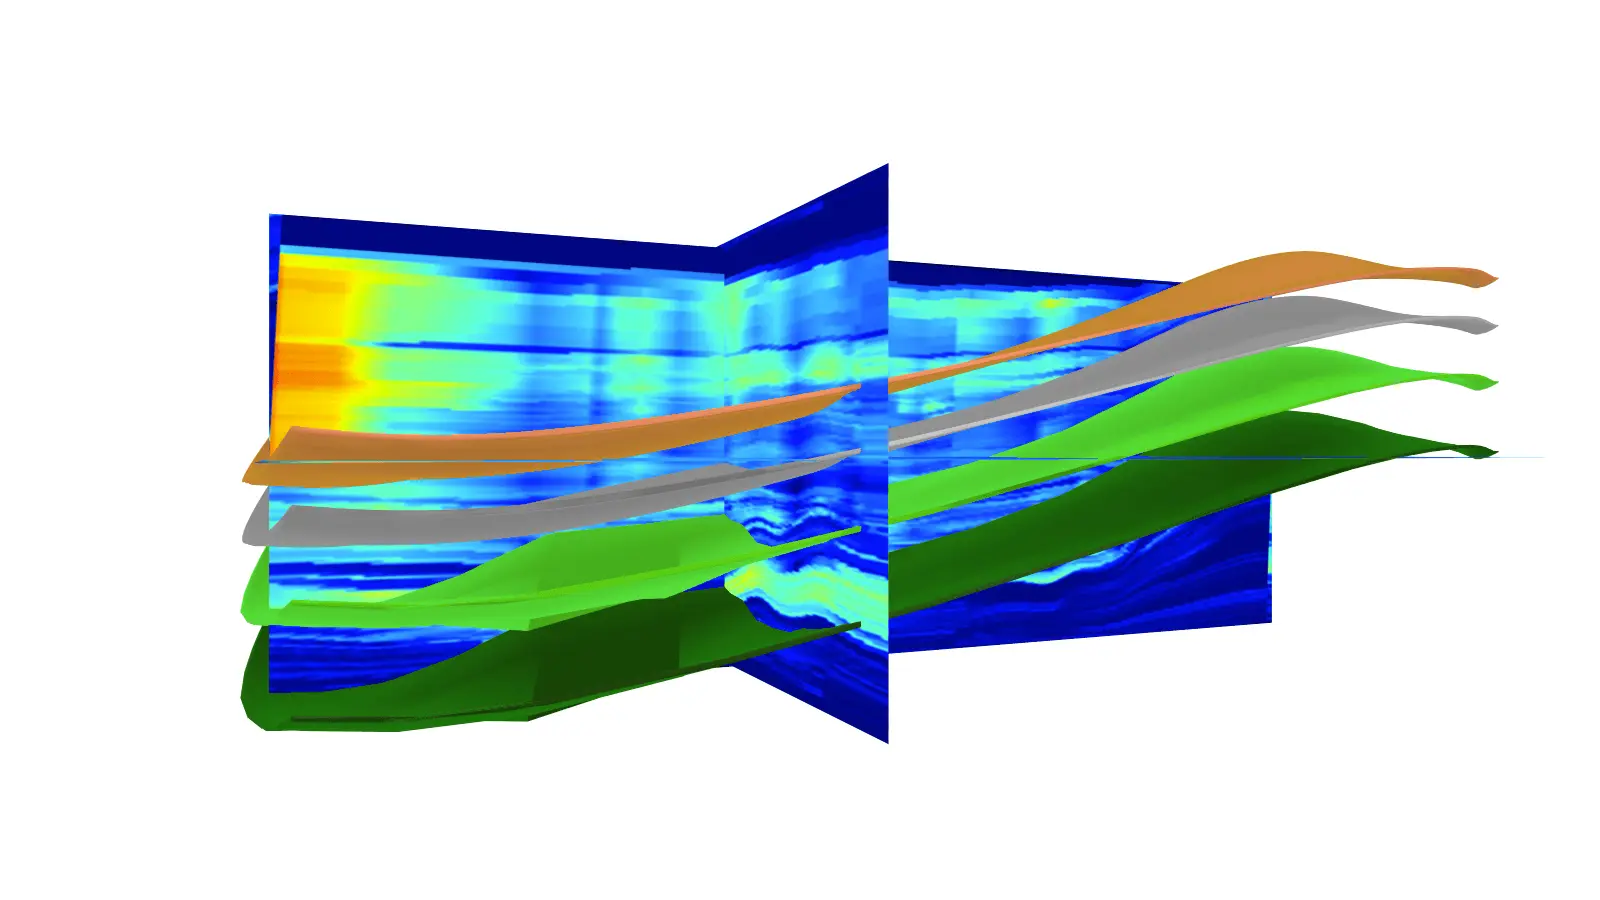
START FREE TRIALDanomics doesn’t stop at just structure, isopach, and property maps – it enables you to build full 3D property models that transform your geological and petrophysical interpretations into actionable reservoir intelligence. With Danomics you can:
- Generate 3D models of properties like porosity, saturation, and oil-in-place
- Extract modeled data into horizontal wells with sparse or missing data to estimate the stimulated oil-in-place and calculate recovery factors based on forecasts of EUR
- Leverage our machine learning tools and Python integration to create predictive models and optimize your future drilling campaigns