Creating a New DCA Project
Once you have loaded in your data you are ready to start a new project. In this tutorial we focus on evaluations using DCA Express.
Create a New Project
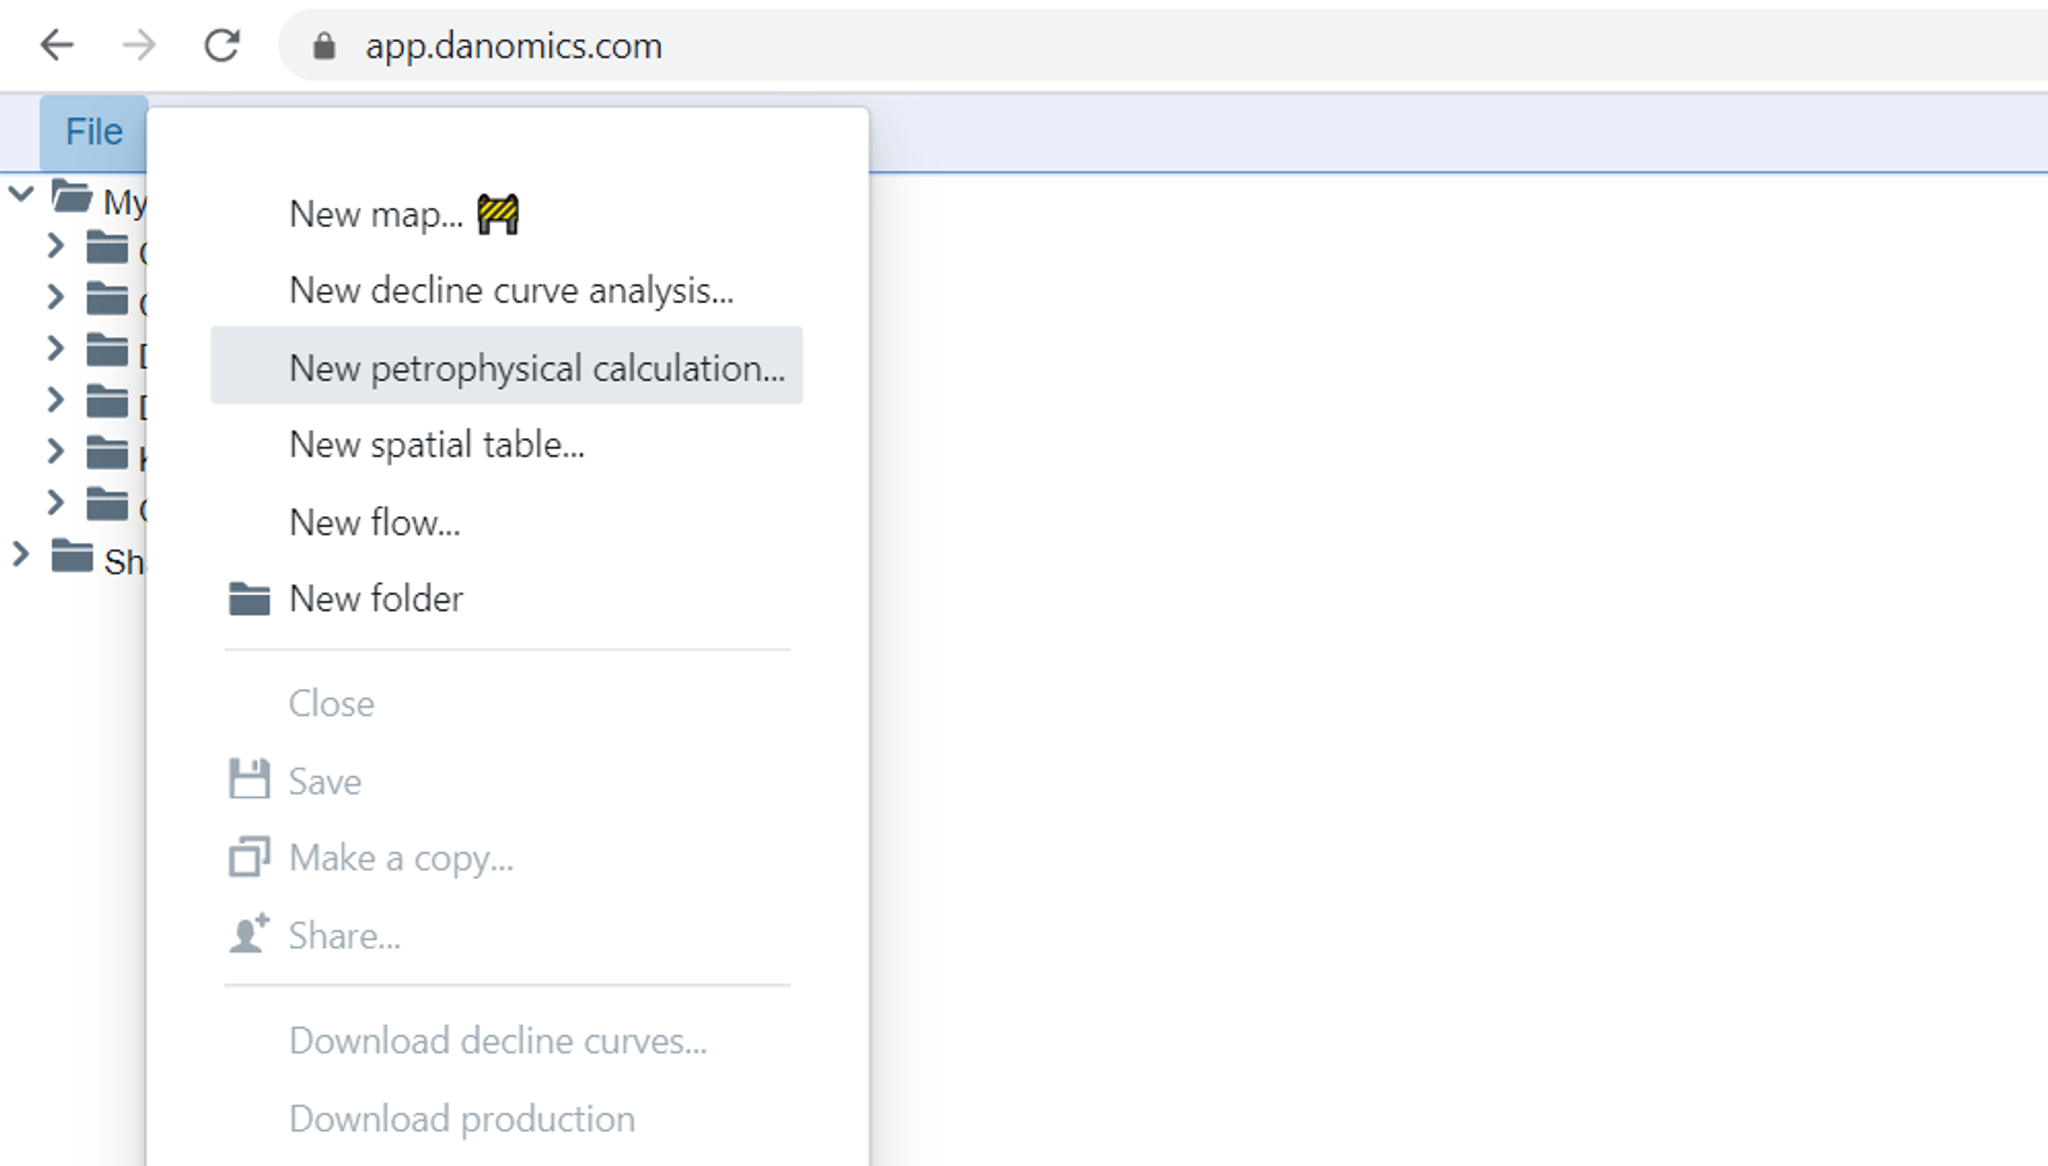
To start a new project go to File>>New Decline Curve Analysis as shown in the image below:
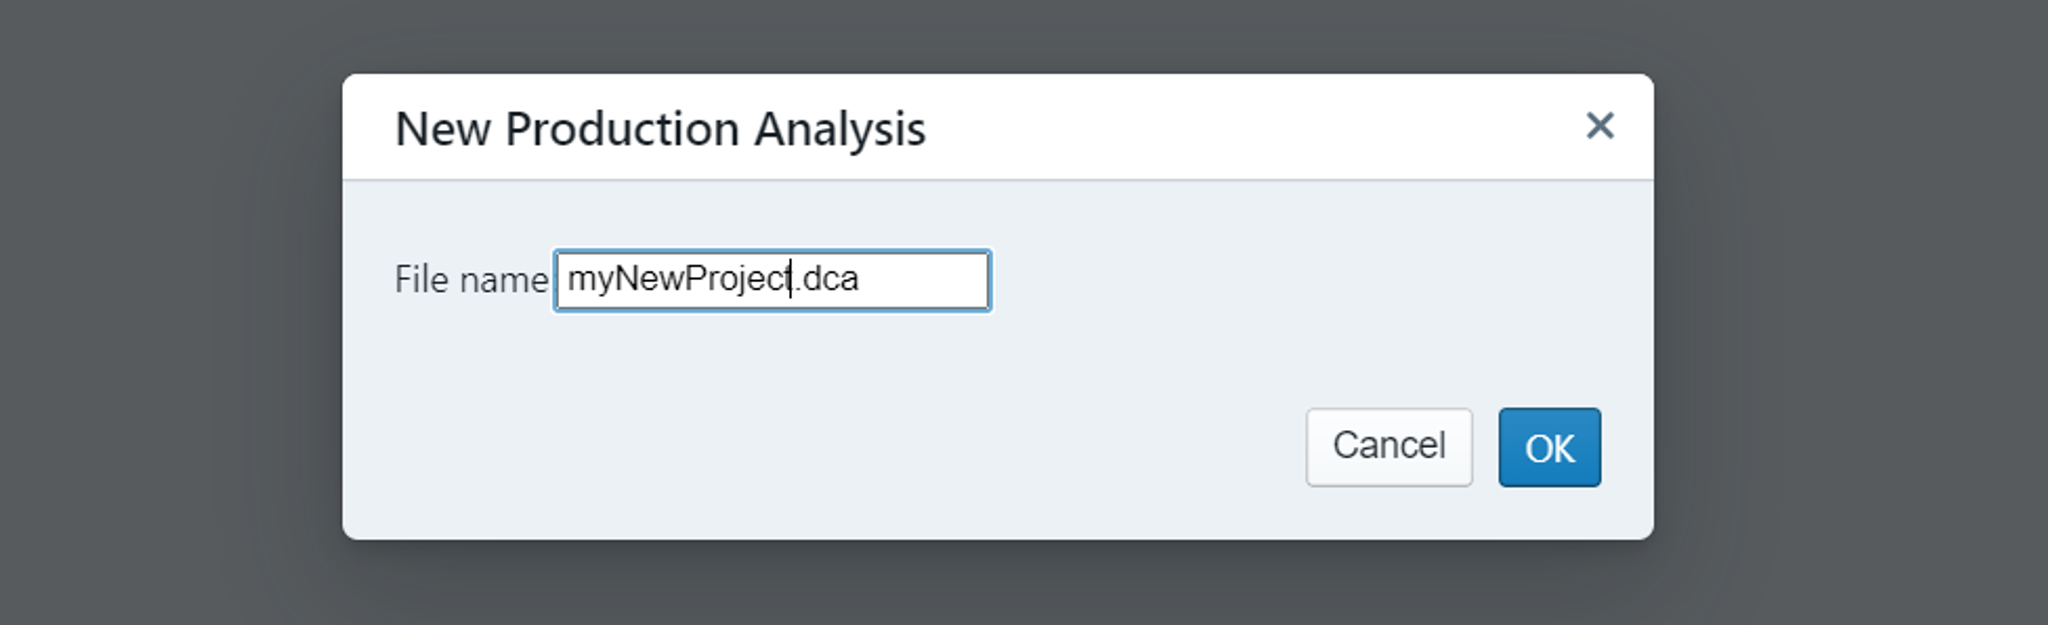
Upon clicking you will be presented with a dialogue as shown below. Enter in a name for your project and click “OK”.
After clicking “OK” you will now have a new, empty project, as shown below:
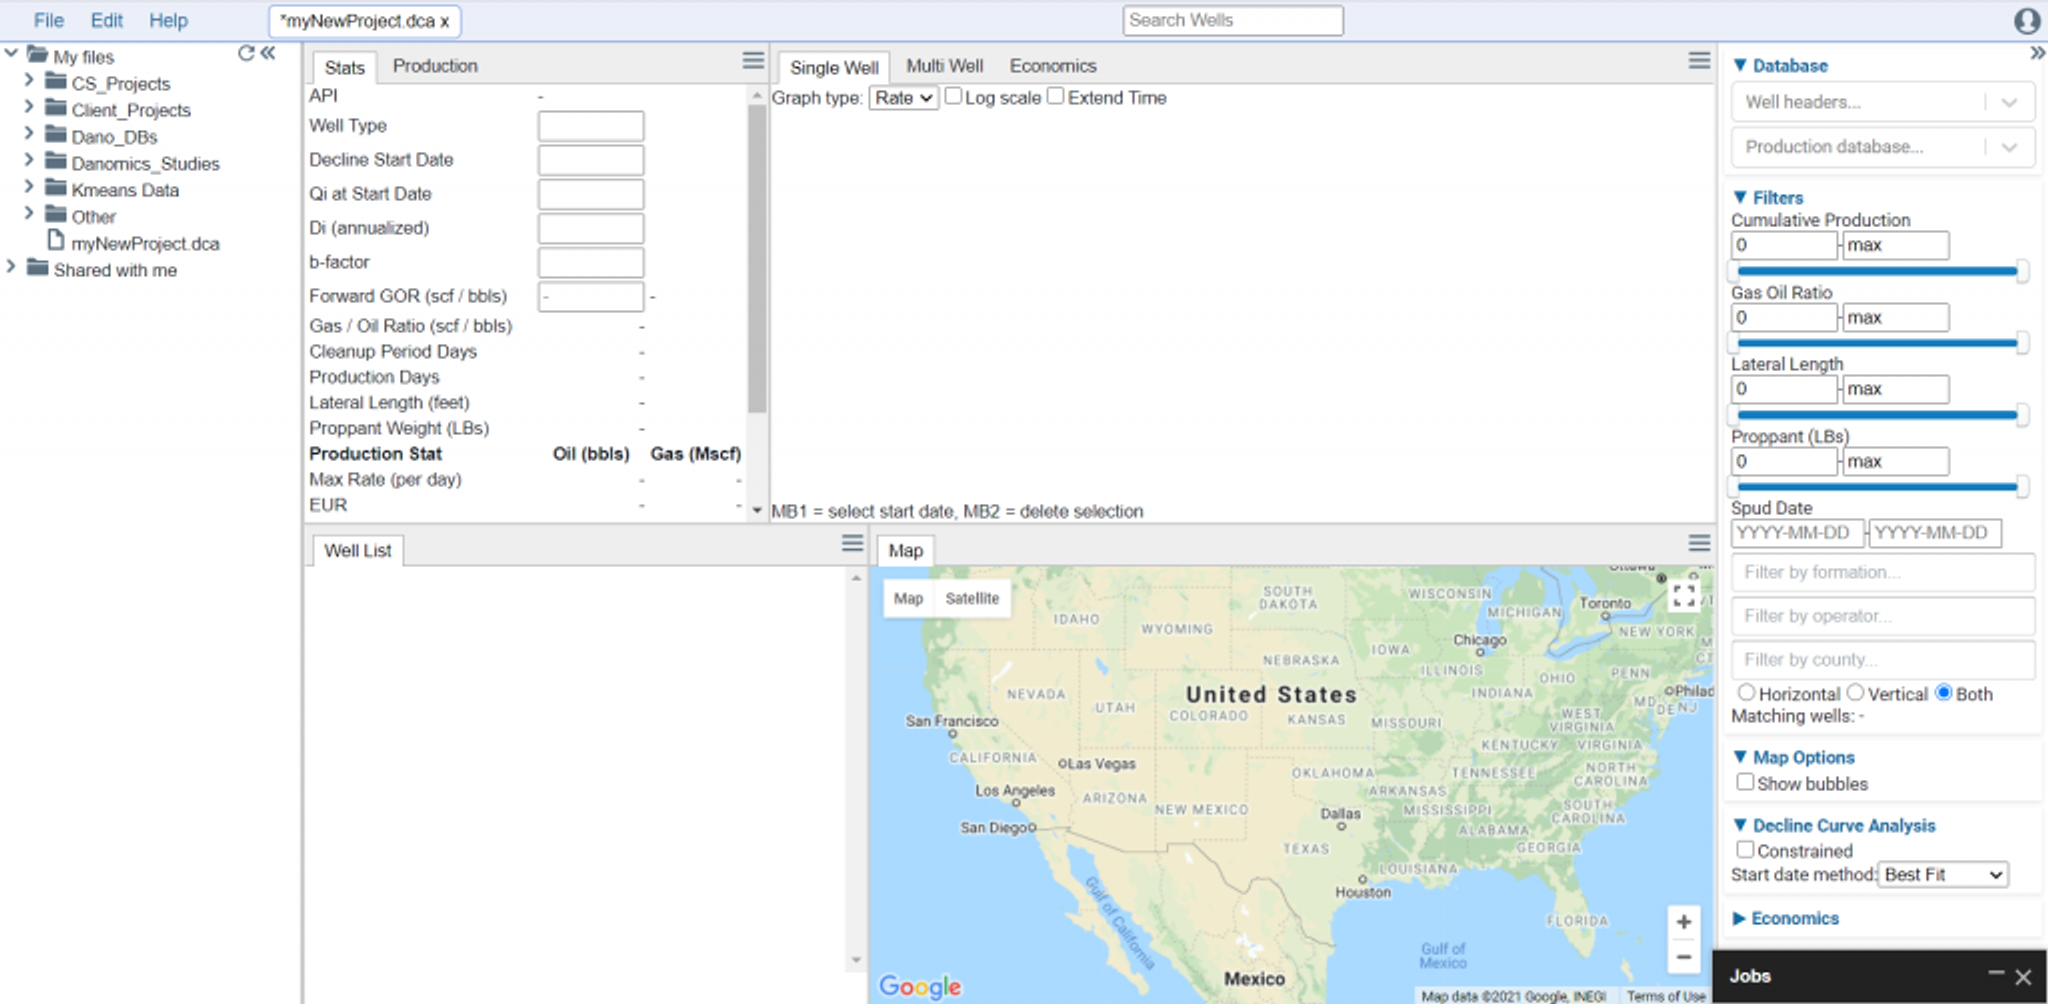
Note: You need to save your project just like with any other software. You can do this by going to File>>Save or hitting ctrl+s on your keyboard. We recommend saving frequently.
Database Selection
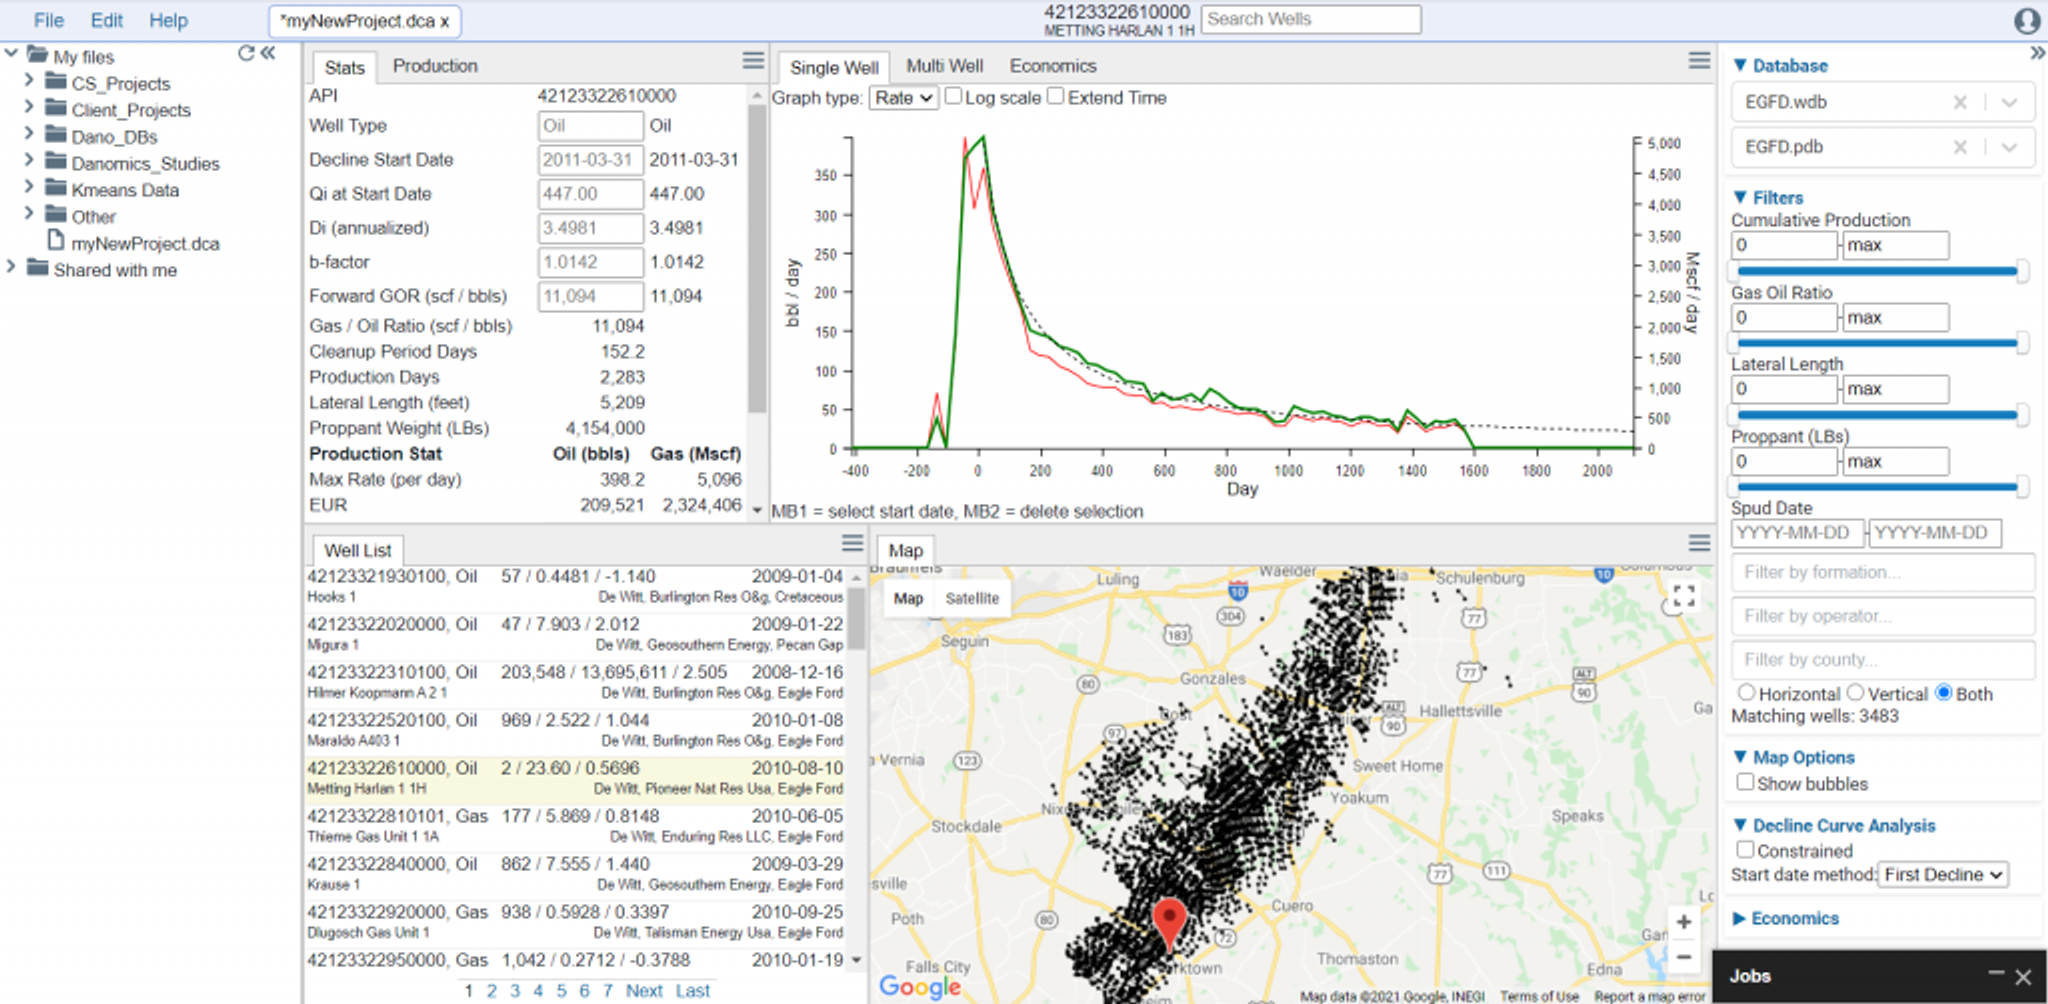
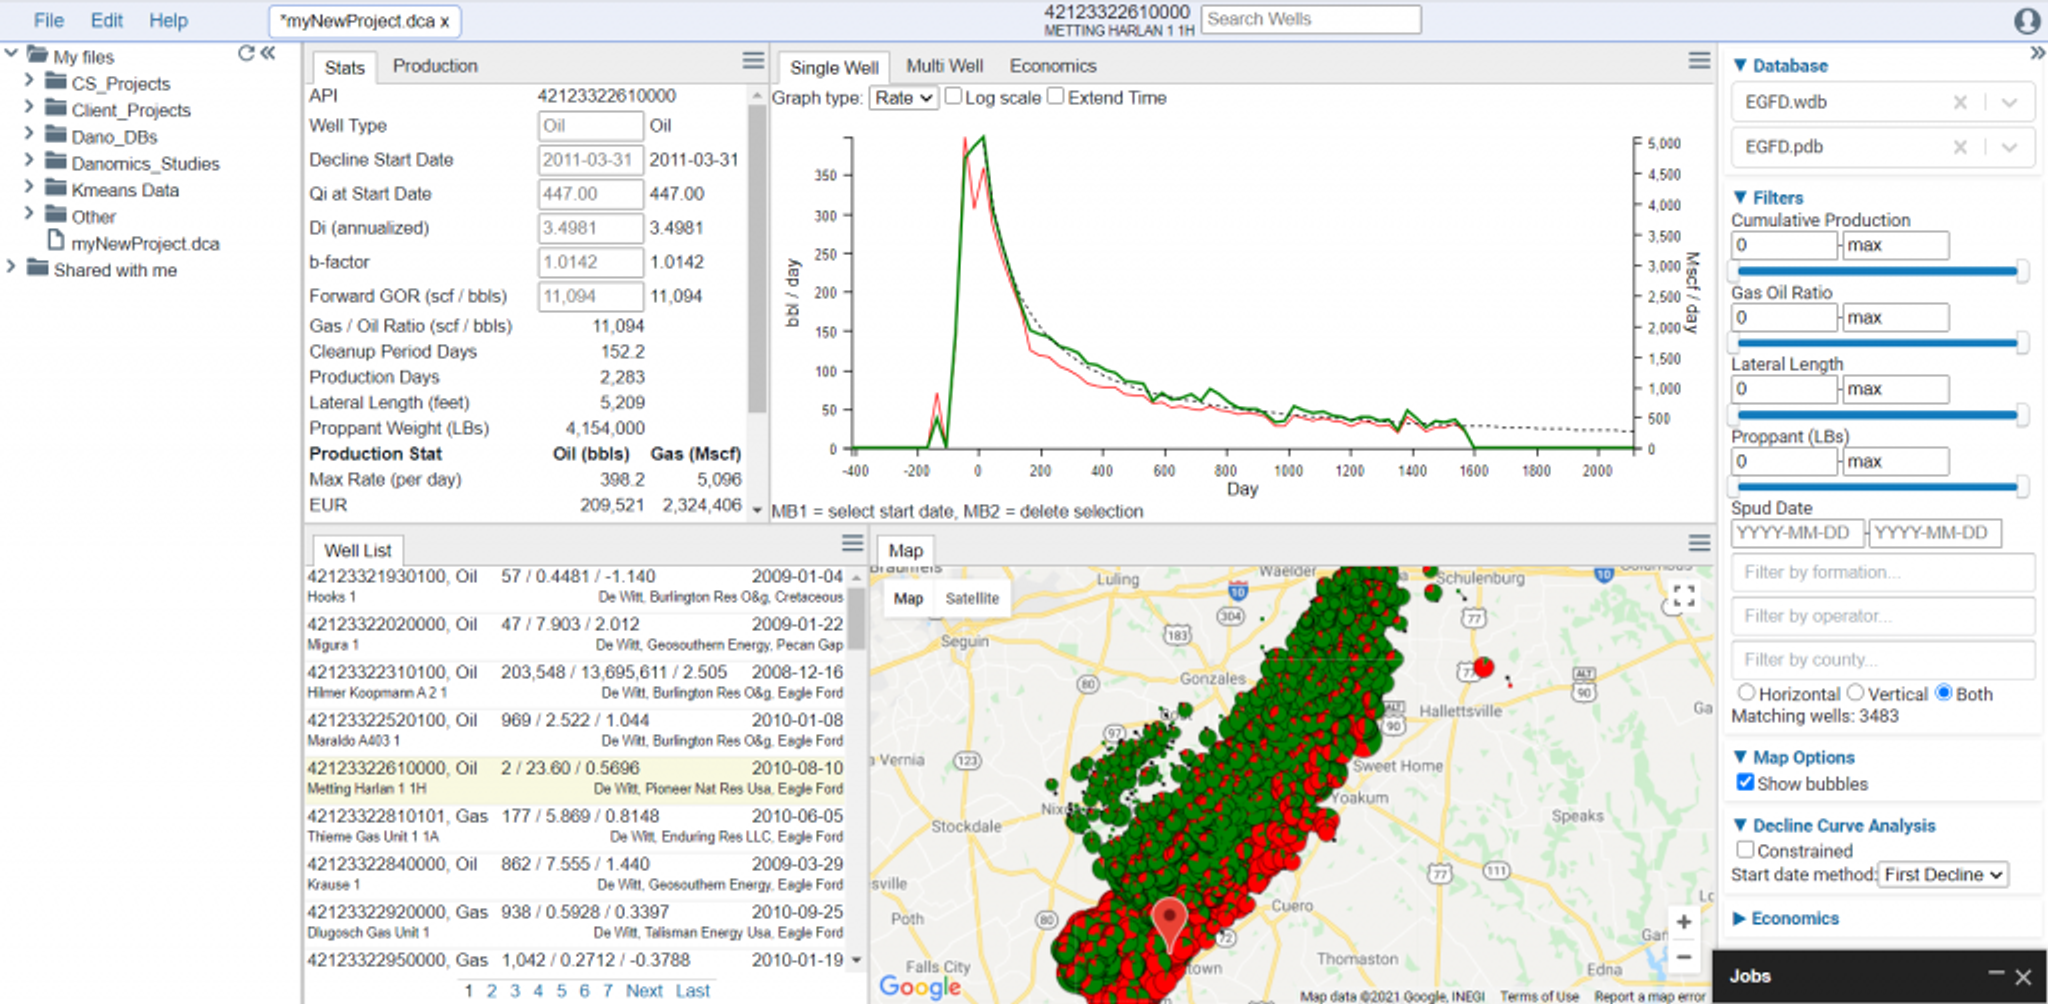
On the top right-hand side of the screen you should see an area labeled “Database”. Below this are two drop-down selection boxes. Only the databases relevant to each will be shown in the dropdown selection menu. Choose the databases for your analysis and save the project – it should now be populated with the data, as shown below. It is required to have both a well header database and production database.
Click on a well in the well list and zoom the map to your area of interest. Your project should be populated and ready to interpret. An example is shown below.
Project Setup
All the wells in your project are immediately interpreted upon loading the databases into the DCA file. If you click from well to well you will see the dashed black line in the production graph showing the forecast. However, this will be an unconstrained analysis. You should consider updating the options based on your interpretational needs.
To visualize the cumulative production bubbles click on the “Show bubbles” option in the control panel to the right.
To access the global analysis constraints, in the control panel on the right click “Constrained” under the Decline Curve Analysis section.
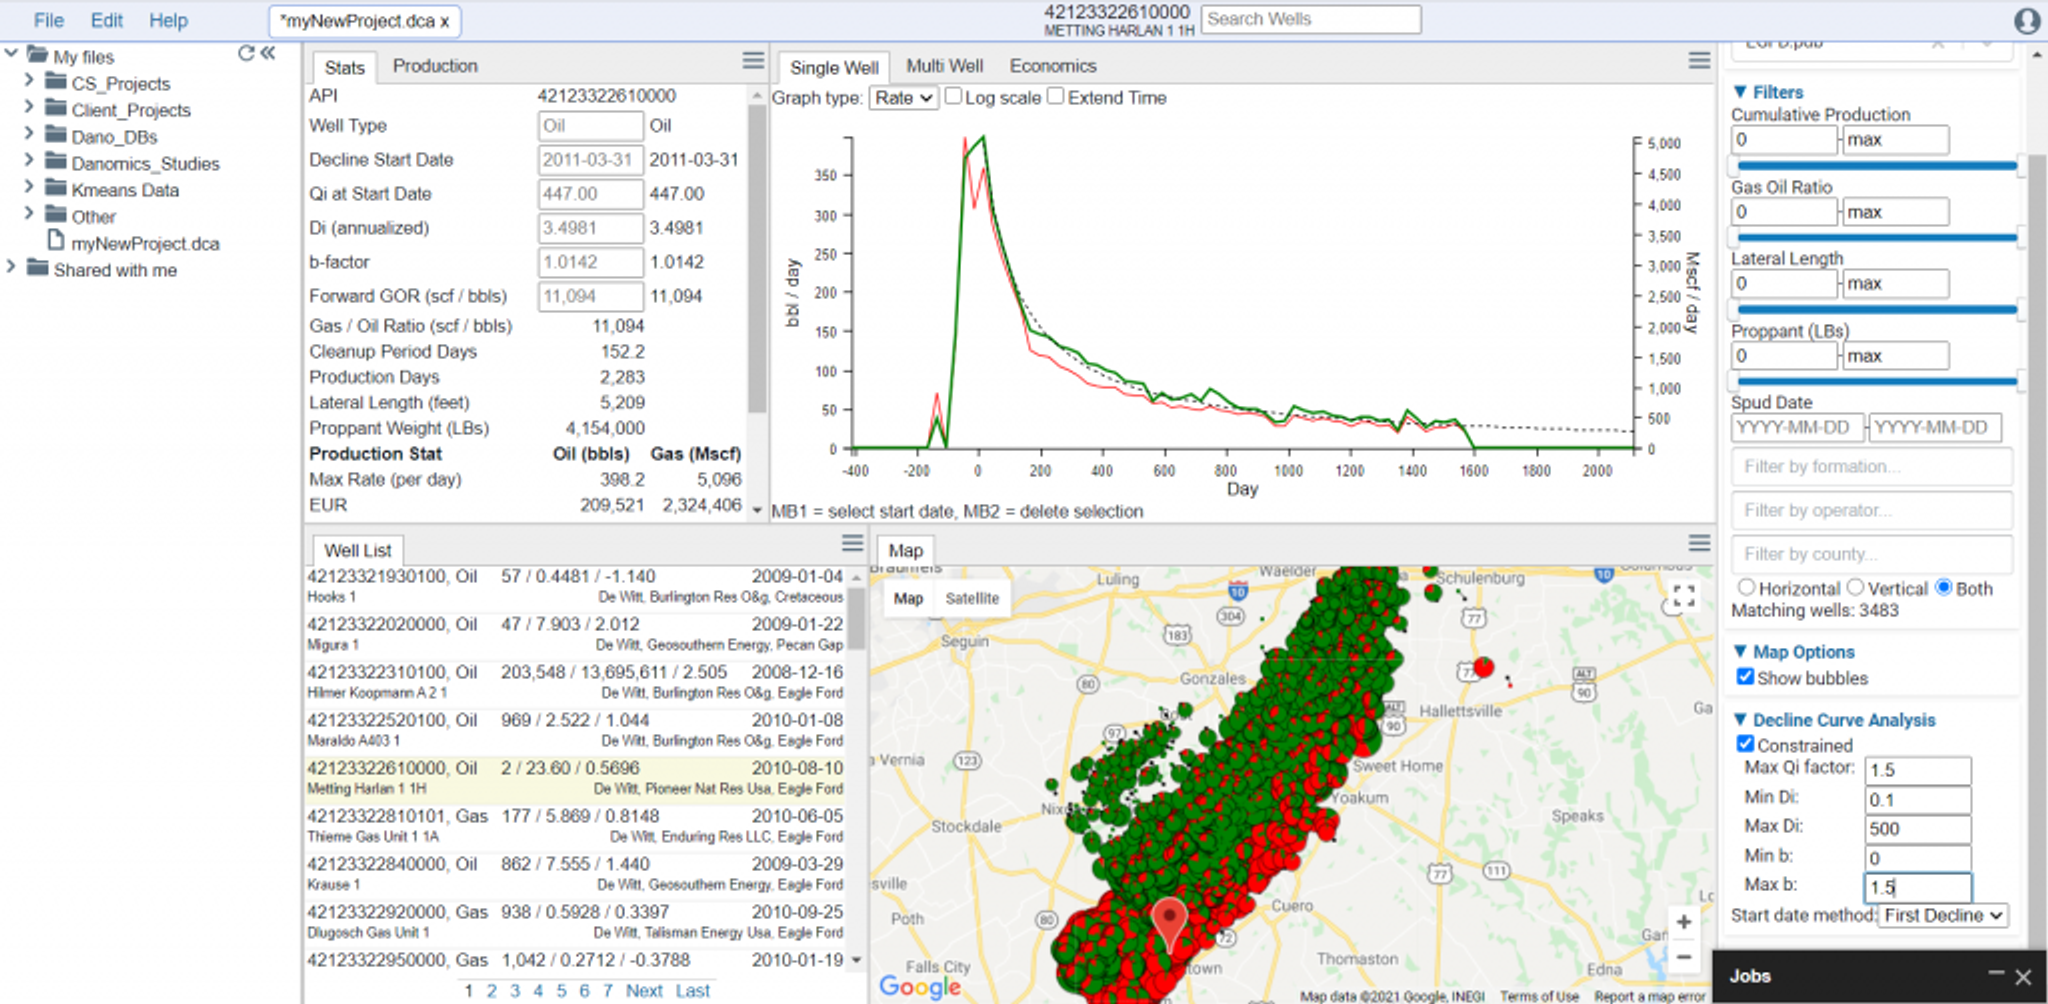
Update the constraints for Qi, Min Di, Max Di, Min b, and Max b and set the start date method to meet your needs. A general description of these options is as follows:
- Max Qi: This controls how high the Qi factor in the Arp’s equation is allowed. A Max Qi of 1.5 would mean that the Qi in the DCA could be 1.5x higher than the maximum observed production for any period (e.g., month). This should be lower for daily data and higher for longer periods.
- Min Di: This sets the minimum for the initial decline variable in Arp’s equation. The recommended setting is 0.1.
- Max Di: This sets the maximum for the initial decline variable in Arp’s equation. The recommended setting is 500.
- Min b: This sets the minimum for the b-factor in Arp’s equation. The recommended setting is 0.
- Max b: This sets the maximum for the b-factor in Arp’s equation. The recommended setting is less than 2.
- Start Date Method: Best Fit is recommended for evaluating remaining reserves while First Decline is recommended for evaluating overall well performance.
Tips and Tricks
- Remember to save your project!
- In the production graph you can toggle between linear and log scales. This can help you evaluate the quality of fit.
- You can choose to view either rate time or both rate time and cum time in the production graph.
- Click on the “extend” time option in the graph window to see the complete forecast.
Tags
Related Insights
DCA: Type well curves
In this video I demonstrate how to generate a well set filtered by a number of criteria and generate a multi-well type curve. Before starting this video you should already know how to load your data and create a DCA project. If not, please review those videos. Type well curves are generated by creating a decline that represents data from multiple wells.
DCA: Loading Production data
In this video I demonstrate how to load production and well header data for use in a decline curve analysis project. The first step is to gather your data. You’ll need: Production data – this can be in CSV, Excel, or IHS 298 formats. For spreadsheet formats you’ll need columns for API, Date, Oil, Gas, Water (optional), and days of production for that period (optional). Well header data – this can be in CSV, Excel, or IHS 297 formats.
Sample data to get started
Need some sample data to get started? The files below are from data made public by the Wyoming Oil and Gas Commission. These will allow you to get started with petrophysics, mapping, and decline curve analysis. Well header data Formation tops data Deviation survey data Well log data (las files) Production data (csv) or (excel) Wyoming counties shapefile and projection Wyoming townships shapefile and projection Haven’t found the help guide that you are looking for?